Московская область г. Королев, мкр. Первомайский ул. Советская (Квартал «Ривер Парк»)
Московская область г. Королев, мкр. Первомайский ул. Советская (Квартал «Ривер Парк»)
Московская область г. Королев ул. Пионерская\Ленина (ЖК Золотые ворота)
Московская область, г. Королев

Московская область г. Королев, мкр. Первомайский ул. Советская (Квартал «Ривер Парк»)
Московская область г. Королев ул. Пионерская\Ленина (ЖК Золотые ворота)
Московская Область г. Королев, ул. Горького (ЖК Валентиновка Парк).
Московская область г. Королев ул. Горького (ЖК Валентиновка Парк).
Московская Область г. Королев, мкр. Болшево ул. Бурковский проезд (ЖК Театральный парк)
Московская Область г. Королев мкр. Болшево ул. Бурковский проезд (ЖК Театральный парк)
Московская область г. Королев ул. Пионерская\Ленина (ЖК Золотые ворота).
Московская область, г. Королев
Московская область г. Королев ул. Горького (ЖК Валентиновка парк)
Московская Область, г. Королев, мкр. Болшево, ул. Бурковский проезд (ЖК Театральный парк)
Московская Область, г. Королев
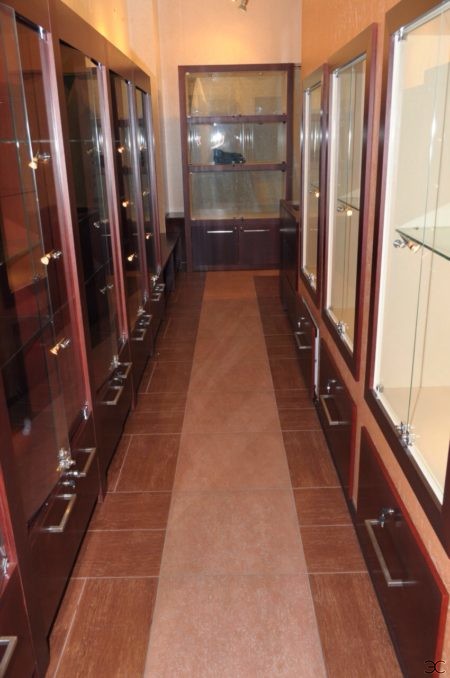
Ремонт магазина подарков под ключ. Декоративная штукатурка, плитка на пол, перенос отопления в магазине, вентиляция и сантехника. Профессиональный электромонтаж, в гофре за потолком из гипсокартона.
Московская Область г. Королев
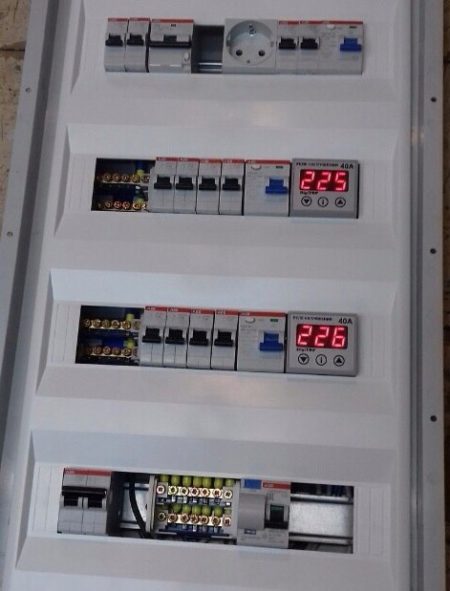
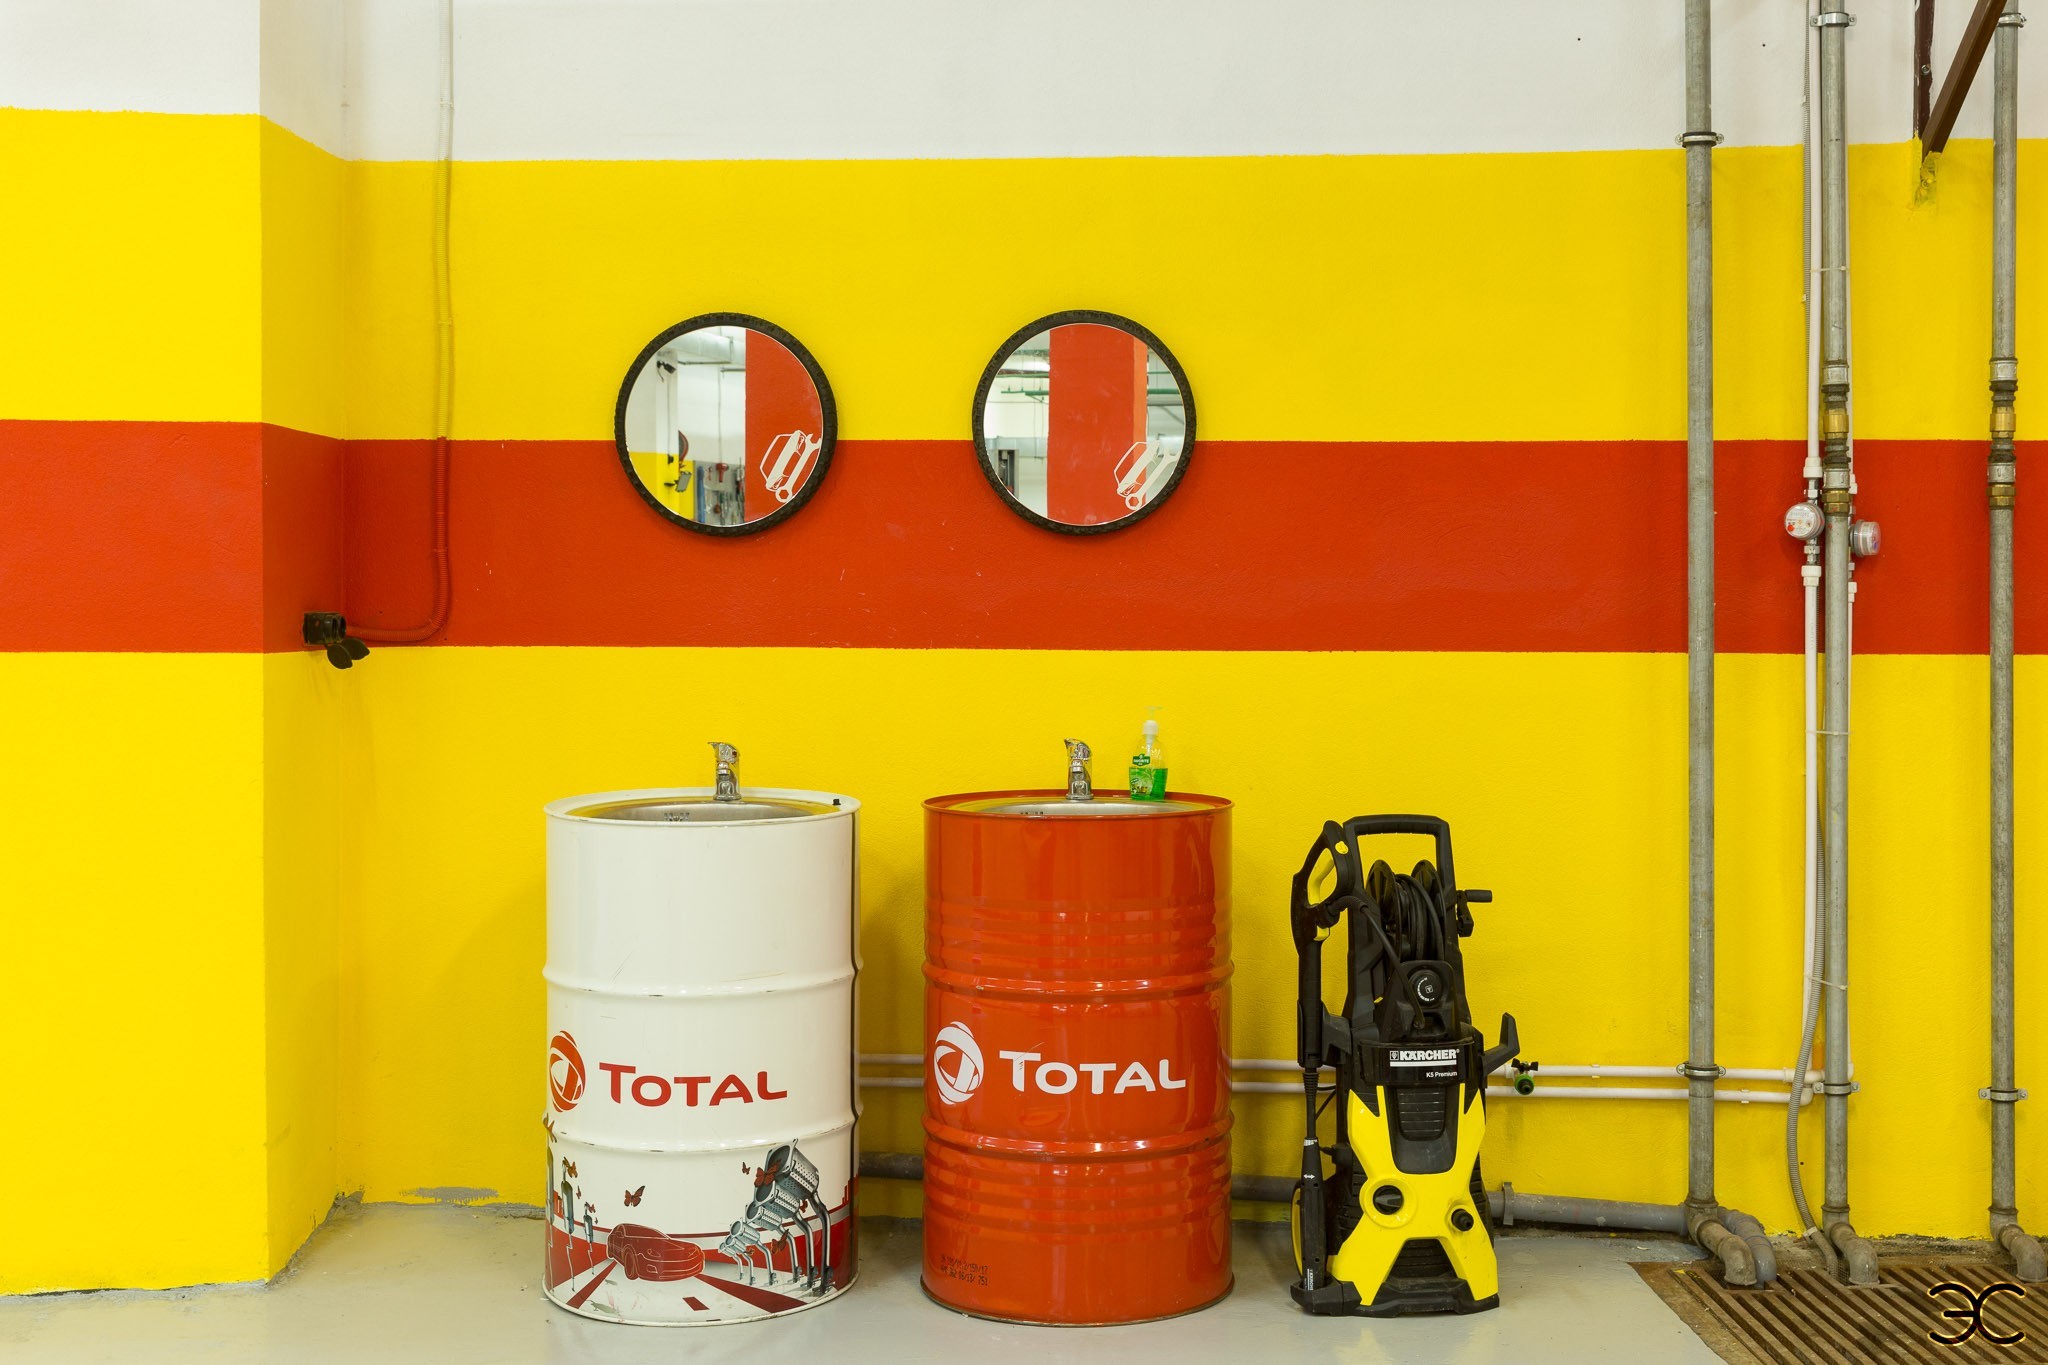
Ремонт и перепланировка офисов производственных помещений, все виды работ. Гипсокартон, плитка малярные работы. Сантехника Электрика Вентиляция Отопление Канализация. Доступные цены, большой опыт работы. Гарантия и последующие обслуживание.